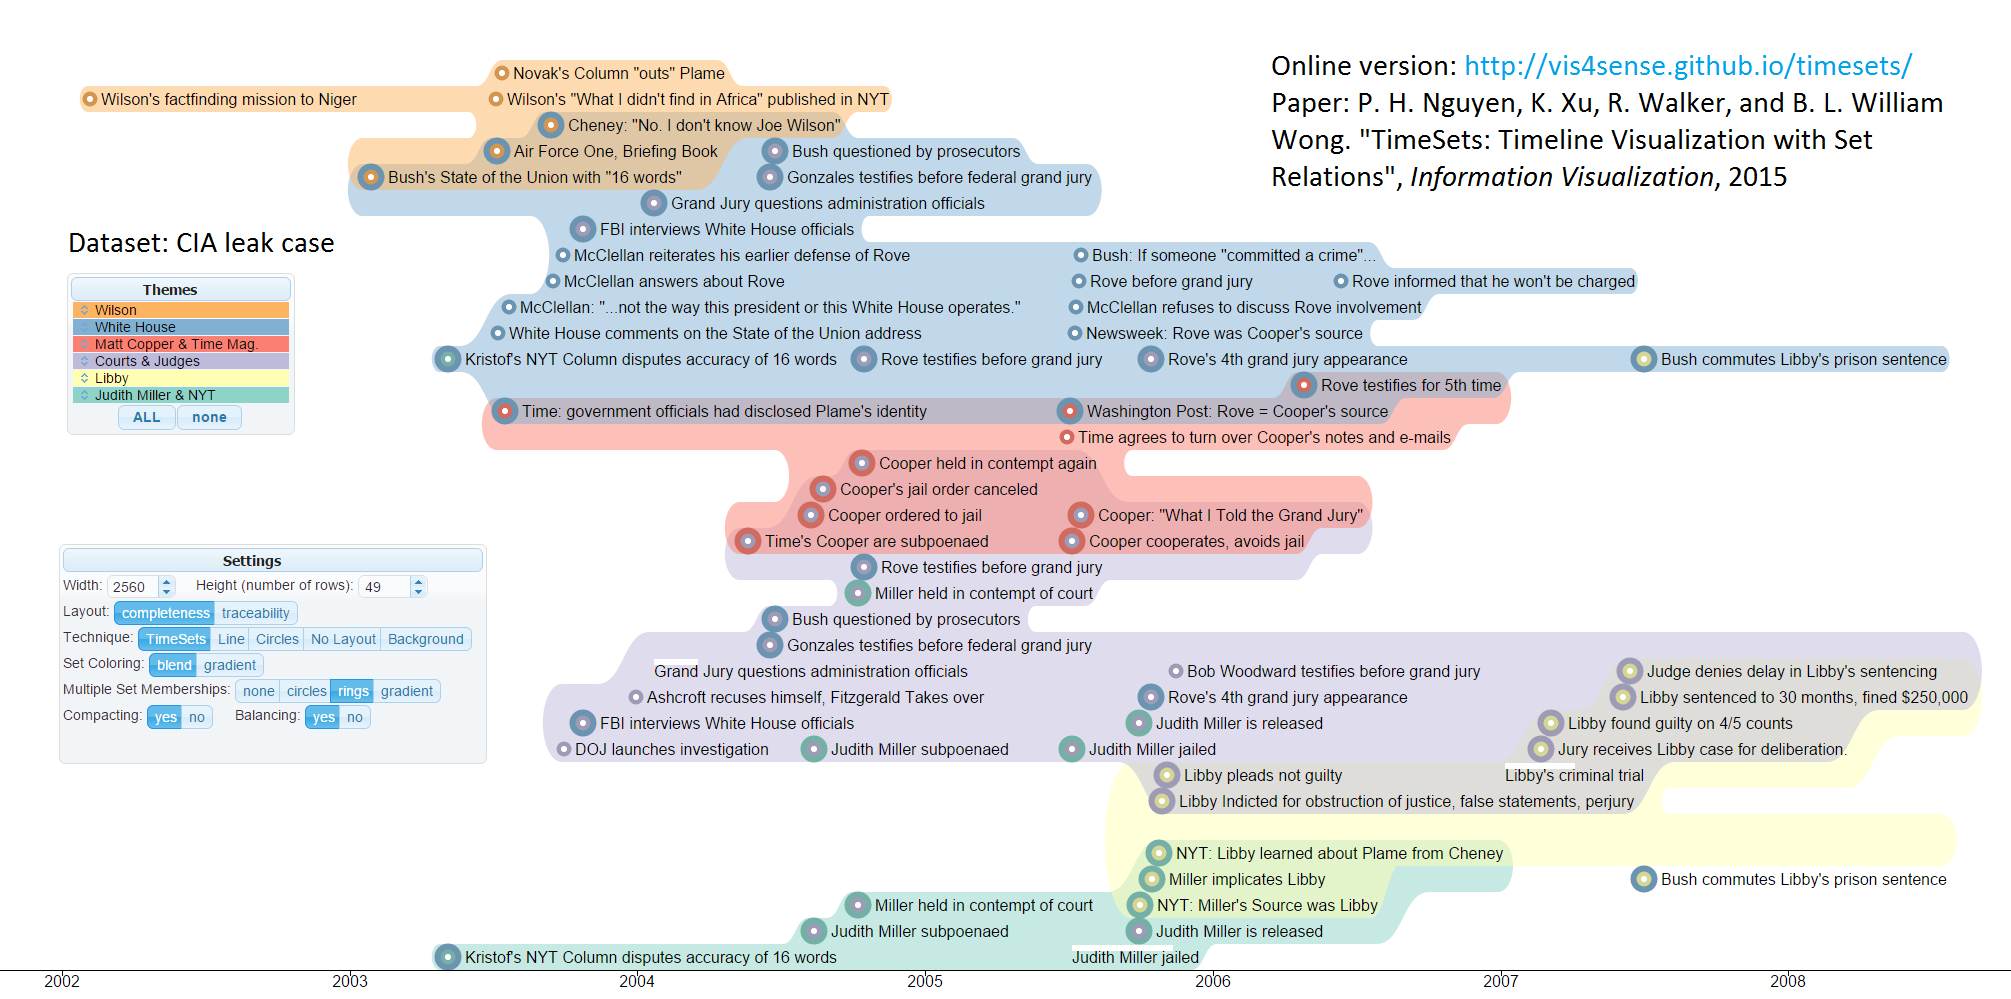
Online Demo
You can explore the CIA Leak case with the TimeSet here.
Paper
P. H. Nguyen, K. Xu, R. Walker, and B. L. William Wong, TimeSets: Timeline Visualization with Set Relations, Information Visualization, 2015. PDF
Current timeline visualisations do not allow grouping the event by a person or organisation. Instead, this is usually done using colour or symbol, which make it difficult to follow a person or organisation.
Grouping events by person or organisation, while keep their temporal order. This makes it easier to:

You can explore the CIA Leak case with the TimeSet here.
P. H. Nguyen, K. Xu, R. Walker, and B. L. William Wong, TimeSets: Timeline Visualization with Set Relations, Information Visualization, 2015. PDF

You can explore the US 2016 Election Facebook Fake News dataset with the TimeSet Uncertainty here.
Saminu Salisu, Kai Xu, Adrian Wagstaff, Mike Biggs and Graham Phillips TimeSets for Uncertainty Visualisation, EG UK Computer Graphics & Visual Computing, 2016. PDF
The TimeSet Uncertainty allows loading of user data through Google Spread Sheet so long as they follow the simple data format.
For TimeSets Uncertainty to work with your Google Spread Sheet, it must have two sheets: one named data and the other named themes. The first row of the data sheet must contains the column name, exactly as describe below:
The themes sheet should only have one column theme with the list of entities that populate the entity list in TimeSets.
This is an example that you can use to create your own spreadsheet. It has all the compulsory and optional columns with some example rows.
Once the data is formatted as described above in the Google Spreadsheet, it can be added to TimeSets Uncertainty using following steps:
file -> publish to web -> entire documents -> publish;share -> copy link e.g. https://docs.google.com/spreadsheets/d/e/pubhtmlhttp://vis4sense.github.io/timesets/uncert/ with ?url=, e.g. http://vis4sense.github.io/timesets/uncert/?url=https://docs.google.com/spreadsheets/pubhtml