SAVI: Social Analytics VIsulisation

VAST Challenge 2014

This is a entry to the VAST Challenge 2014 Mini-Challenge 3 and won an Honourable Mention.

The challenge provides a collect of tweets (micro blogs) and the task is to create a narrative describing the criminal activities hidden within.

SAVI: Social Analytics VIsulisation

SAVI is the visual analytics tool we developed. It has three components:

Timeline visualisation

Each line is a tweet.

Tweets about the same person or organisation are grouped together with the same-coloured background. This colour matches to the selection in the entity list on the right.

At the bottom is a histogram showing tweet frequency over time.

Map visualisation

Each circle on the map is an event with location information.

The circle colour indicates event time, as shown on the right.

The blue circles are user selected events, whose details are shown in the table below the map.

Sensemaking tool

Each card is a finding: including a thumbnail of the visualisation that led to the discovery and a text description.

Finding cards can be arranged to form groups, or connected showing temporal and/or logical connections.

Findings can be shared among the users (the left list) and the tool also tracks all the changes in the workspace (the bottom diagram).

Video

Paper

K. Xu, P. H. Nguyen, and B. Fields, Visual analysis of streaming data with SAVI and SenseMAP, IEEE Conference on Visual Analytics Science and Technology. 2015. PDF

Online Demo

Timeline visualisation

Sensemaking tool

User Guide

User and Registration

There is no authentication yet. A new user simply enters their name and clicks Register to create a new account. If you're already registered, select your name on the list to start.

Workspace

Enter a name to create a new workspace, such as "VAST Challenge 2014 MC1". An empty workspace will be displayed on the right side. If you want to open an existing one, simply select it on the list.

Findings

A finding can be created by clicking the Add button.

You can copy and paste an image (Ctrl + V) to a finding. (Hint: this Chrome extension can capture and edit screenshot.)

Note: the text description appears in the workspace under the screenshot.

Description: a more detailed description

Tags: does what the name says; separated by hitting tab, enter or comma.

Workspace

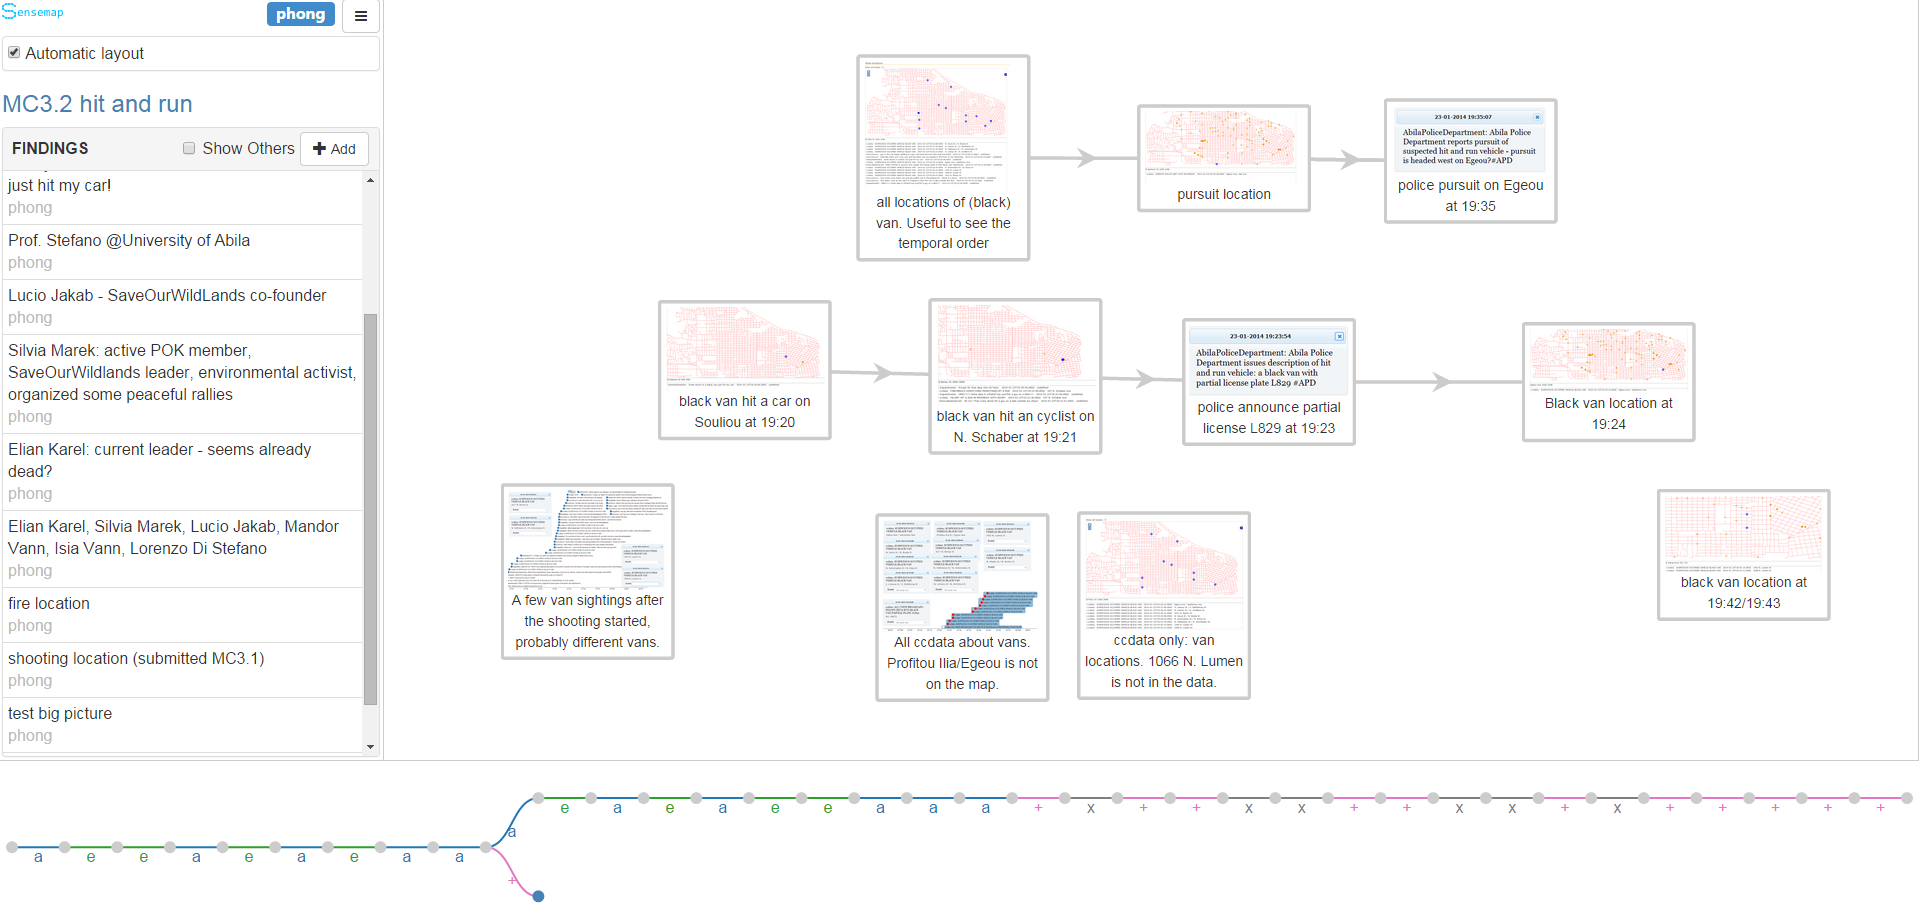
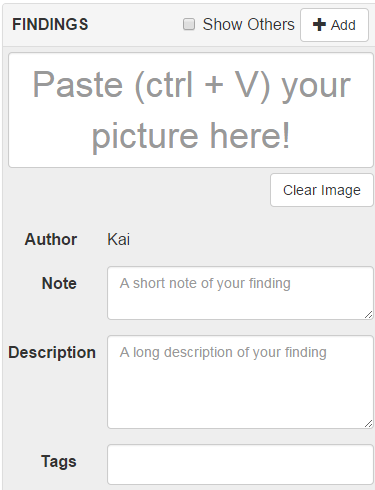
Drag a finding from the left panel to add it to the workspace.

Mouse wheel to zoom and drag to pan the workspace.

Move an individual nodes within the workspace by dragging it.

Draw links between nodes by righting click the source node and then drag it to the target node.

To edit a finding card, click it and then edit the contents on the left pane.

In the top-left corner, there is an option to turn on/off the automatic layout. If on, the system will automatically arrange nodes and links using a hierarchical layout.

The bottom panel records all editing happened in the workspace such as a new finding is added or a new link is drawn. Each editing is shown using different symbols such as 'a' means 'a finding is added'. Click a symbol to revert the workspace to that state.

Collaboration

All findings are visible to all users, no matter who created it. The username indicates the author of the finding.

All workspaces are also visible to all users. Two users can collaborate on the same workspace in real-time. There is no indication of who is working on a workspace yet.